This section provides a demographic portrait of Latinxs in the U.S. as defined by the U.S. Census. It also illustrates some of the tensions between how Latinxs identify and the ways the Census categorizes and counts peoples of Latinx origins, both historically and in the present. According to the Pew Research Center, the U.S. Hispanic population totaled 62.5 million in 2021, making up nearly one-in-five people in the U.S., up from 50.5 million in 2010.2 People of Mexican origin accounted for nearly 60% (about 37.2 million people) of the total Hispanic population, however, their numbers increased by only 13% from 2010 to 2021, the smallest rate of increase among the largest Hispanic groups. Puerto Ricans, the second largest group, make up 9.3% of the Hispanic population with 5.8 million people on the mainland and another 3.1 million on the island. Salvadorans, Cubans, Dominicans, Guatemalans, Colombians, and Hondurans are the next largest groups, each comprised of one million or more people. Those with origins in Venezuela, the Dominican Republic, Honduras, and Guatemala experienced the fastest population growth from 2010 to 2021.3 These numbers are reflected in Table 2.1.1.
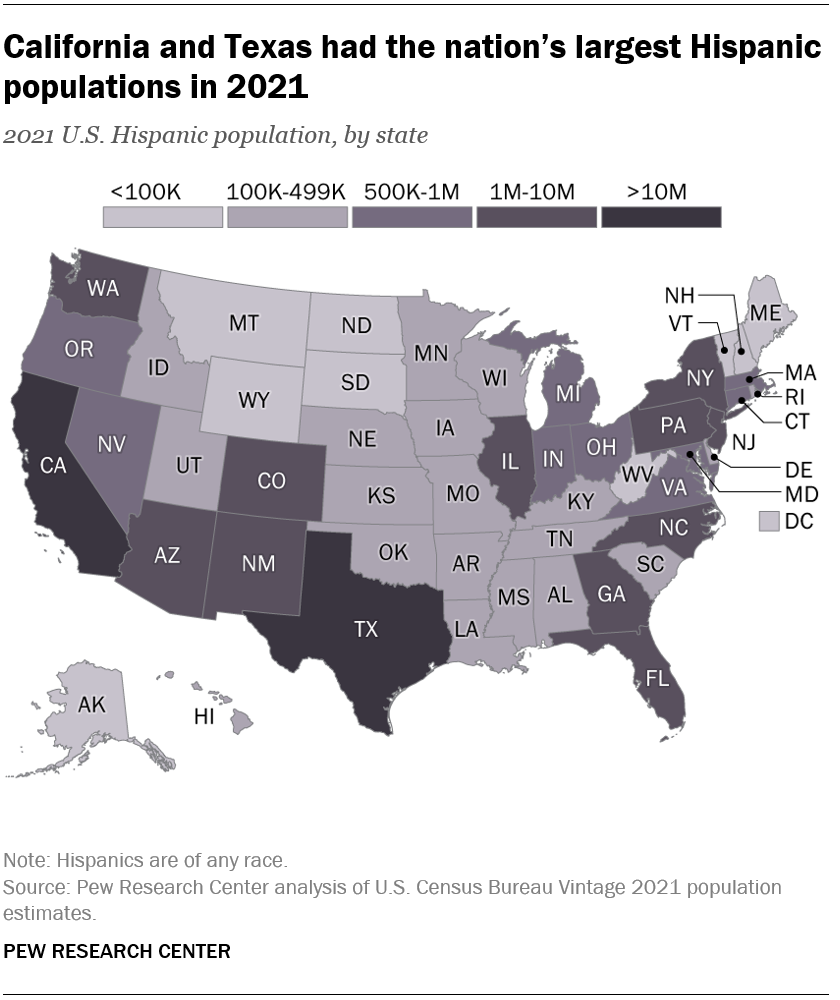
California is the state with the largest Hispanic population in the United States.4 Hispanics became the largest racial or ethnic group in the state in 2014, surpassing the non-Hispanic white population, whose numbers have been on the decline, reflecting a broader national trend.5 In 2021 there were about 15.8 million Hispanics in California, accounting for 40% of the total population, which was up from 14.0 million in 2010. Figure 2.1.1 displays the numbers of Latinos in each of the 50 states, with Texas at more than 10 million, Washington, Arizona, New Mexico, Colorado, Florida, New York, and others reporting 1 to 10 million, Oregon, Nevada, Michigan, and others reporting 500,000 to 1 million, Utah, Idaho, and many states in the South and Midwest reporting 100,000 to 149,000, and North and South Dakota, Maine, Vermont, and others reporting less than 100,000.
The demographic information that follows is largely based on data gathered by The United States Census Bureau (USCB) through their decennial census. To determine the racial and ethnic composition of the nation in 2020, the census included two separate questions––one for Hispanic, Latino, or Spanish origin and one for race. According to USCB, Hispanic, Latino, or Spanish origin is defined as a person of Cuban, Mexican, Puerto Rican, South or Central American, or other Spanish culture or origin, regardless of race.6 In other words, USCB does not consider Hispanic or Latino to be a race, asserting that the categories “generally reflected social definitions in the U.S. and were not an attempt to define race biologically, anthropologically, or genetically. We recognize that the race categories include racial and national origins and sociocultural groups.”7 In 2020 the census options for race included White, Black or African American, American Indian or Alaska Native, Asian, Native Hawaiian and Pacific Islander, and Some Other Race.8 All census respondents, including those who check Hispanic, Latino, or Spanish origin, are given the option to select one or more races to define themselves.
Pause and Reflect: How do You Identify?
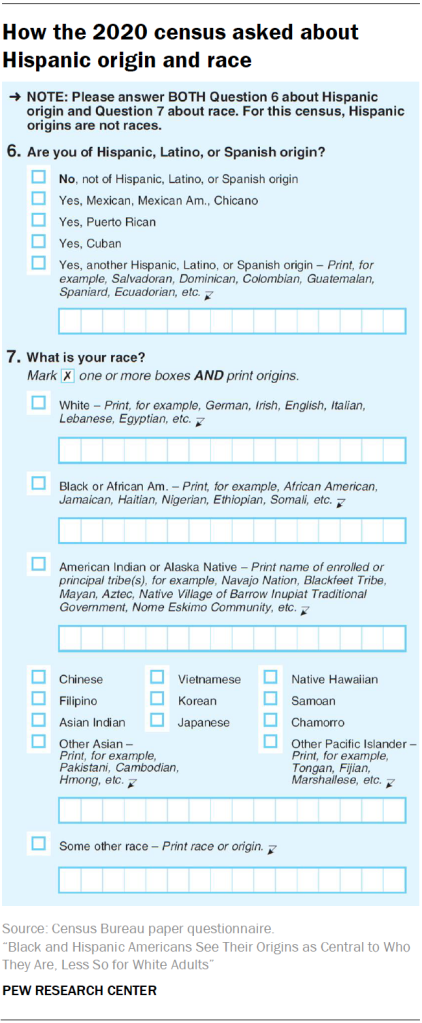
Figure 2.1.2 features two census questions used to ask about race and ethnicity. Number 6 asks “Are you of Hispanic, Latino, or Spanish origin?” The options for responses are:
No, not of Hispanic, Latino, or Spanish origin
Yes, Mexican, Mexican Am., Chicano
Yes, Puerto Rican
Yes, Cuban
Yes, another Hispanic, Latino, or Spanish origin – Print, for example, Salvadoran, Dominican, Colombian, Guatemalan, Spaniard, Ecuadorian, etc.
Question 7 asks “What is your race?” with options to mark one or more boxes to identify your race and to fill in origin information within each category. The options for responses are:
White – Print, for example, German, Irish, English, Italian, Lebanese, Egyptian, etc.
Black or African Am. – Print for example, African American, Jamaican, Haitian, Nigerian, Ethiopian, Somali, etc.
American Indian or Alaska Native – Print name of enrolled or principal tribe(s), for example, Navajo Nation, Blackfeet Tribe, Mayan, Aztec, Native Village of Barrow inupiaq Traditional Government, Nome Eskimo Community, etc.
Chinese
Vietnamese
Native Hawaiian
Filipino
Korean
Samoan
Asian Indian
Japanese
Chamorro
Other Asian – Print, for example, Pakistani, Cambodian, Hmong, etc.
Other Pacific Islander – Print, for example, Tongan, Fijian, Marshallese, etc.
Some other race – Print race or origin.
Take a few moments to review and respond to questions 6 and 7. When you are finished, think about why you made the selections you did. Do the options provided reflect how you self-identify? Would you change anything about the categorizations or the labels? How does this form compare to others that have asked for your race and ethnicity, such as school documents, employment applications, and medical forms?
The results of the 2020 census indicated that 15.1% of the total population (about 49.9 million people) selected the Some Other Race box alone or in combination, making it the second-largest race group. Interestingly,
[a]pproximately 45.3 million people of Hispanic or Latino origin were classified as Some Other Race either alone or in combination, compared with only 4.6 million people who were not of Hispanic or Latino origin. Nearly all of those who were classified as Some Other Race alone were of Hispanic or Latino origin (26.2 million out of 27.9 million, or 93.9%).9
According to USCB, “many Hispanic or Latino respondents answered the separate question on race by reporting their race as ‘Mexican,’ ‘Hispanic,’ ‘Latin American,’ ‘Puerto Rican,’ etc.,” similar to the 2010 Census.10 Moreover, “[t]he number of Latinos who say they are multiracial has increased dramatically. Almost 28 million Latinos identified with more than one race in 2020, up from just 3 million in 2010.”11 A January 2020 Pew Research Center survey revealed that “only about half of Americans said the census reflects how they see their own race and origin ‘very well.’” When comparing Hispanic, Black, and white respondents, Hispanics were more likely to say the questions described them “not too well” or “not well at all,” suggesting they found the categories as not providing relevant options.12 In fact, a 2015 Pew Research Center survey found “…for two-thirds of Hispanics, their Hispanic background is a part of their racial background––not something separate. This suggests that Hispanics have a unique view of race that doesn’t necessarily fit within the official U.S. definitions.”13
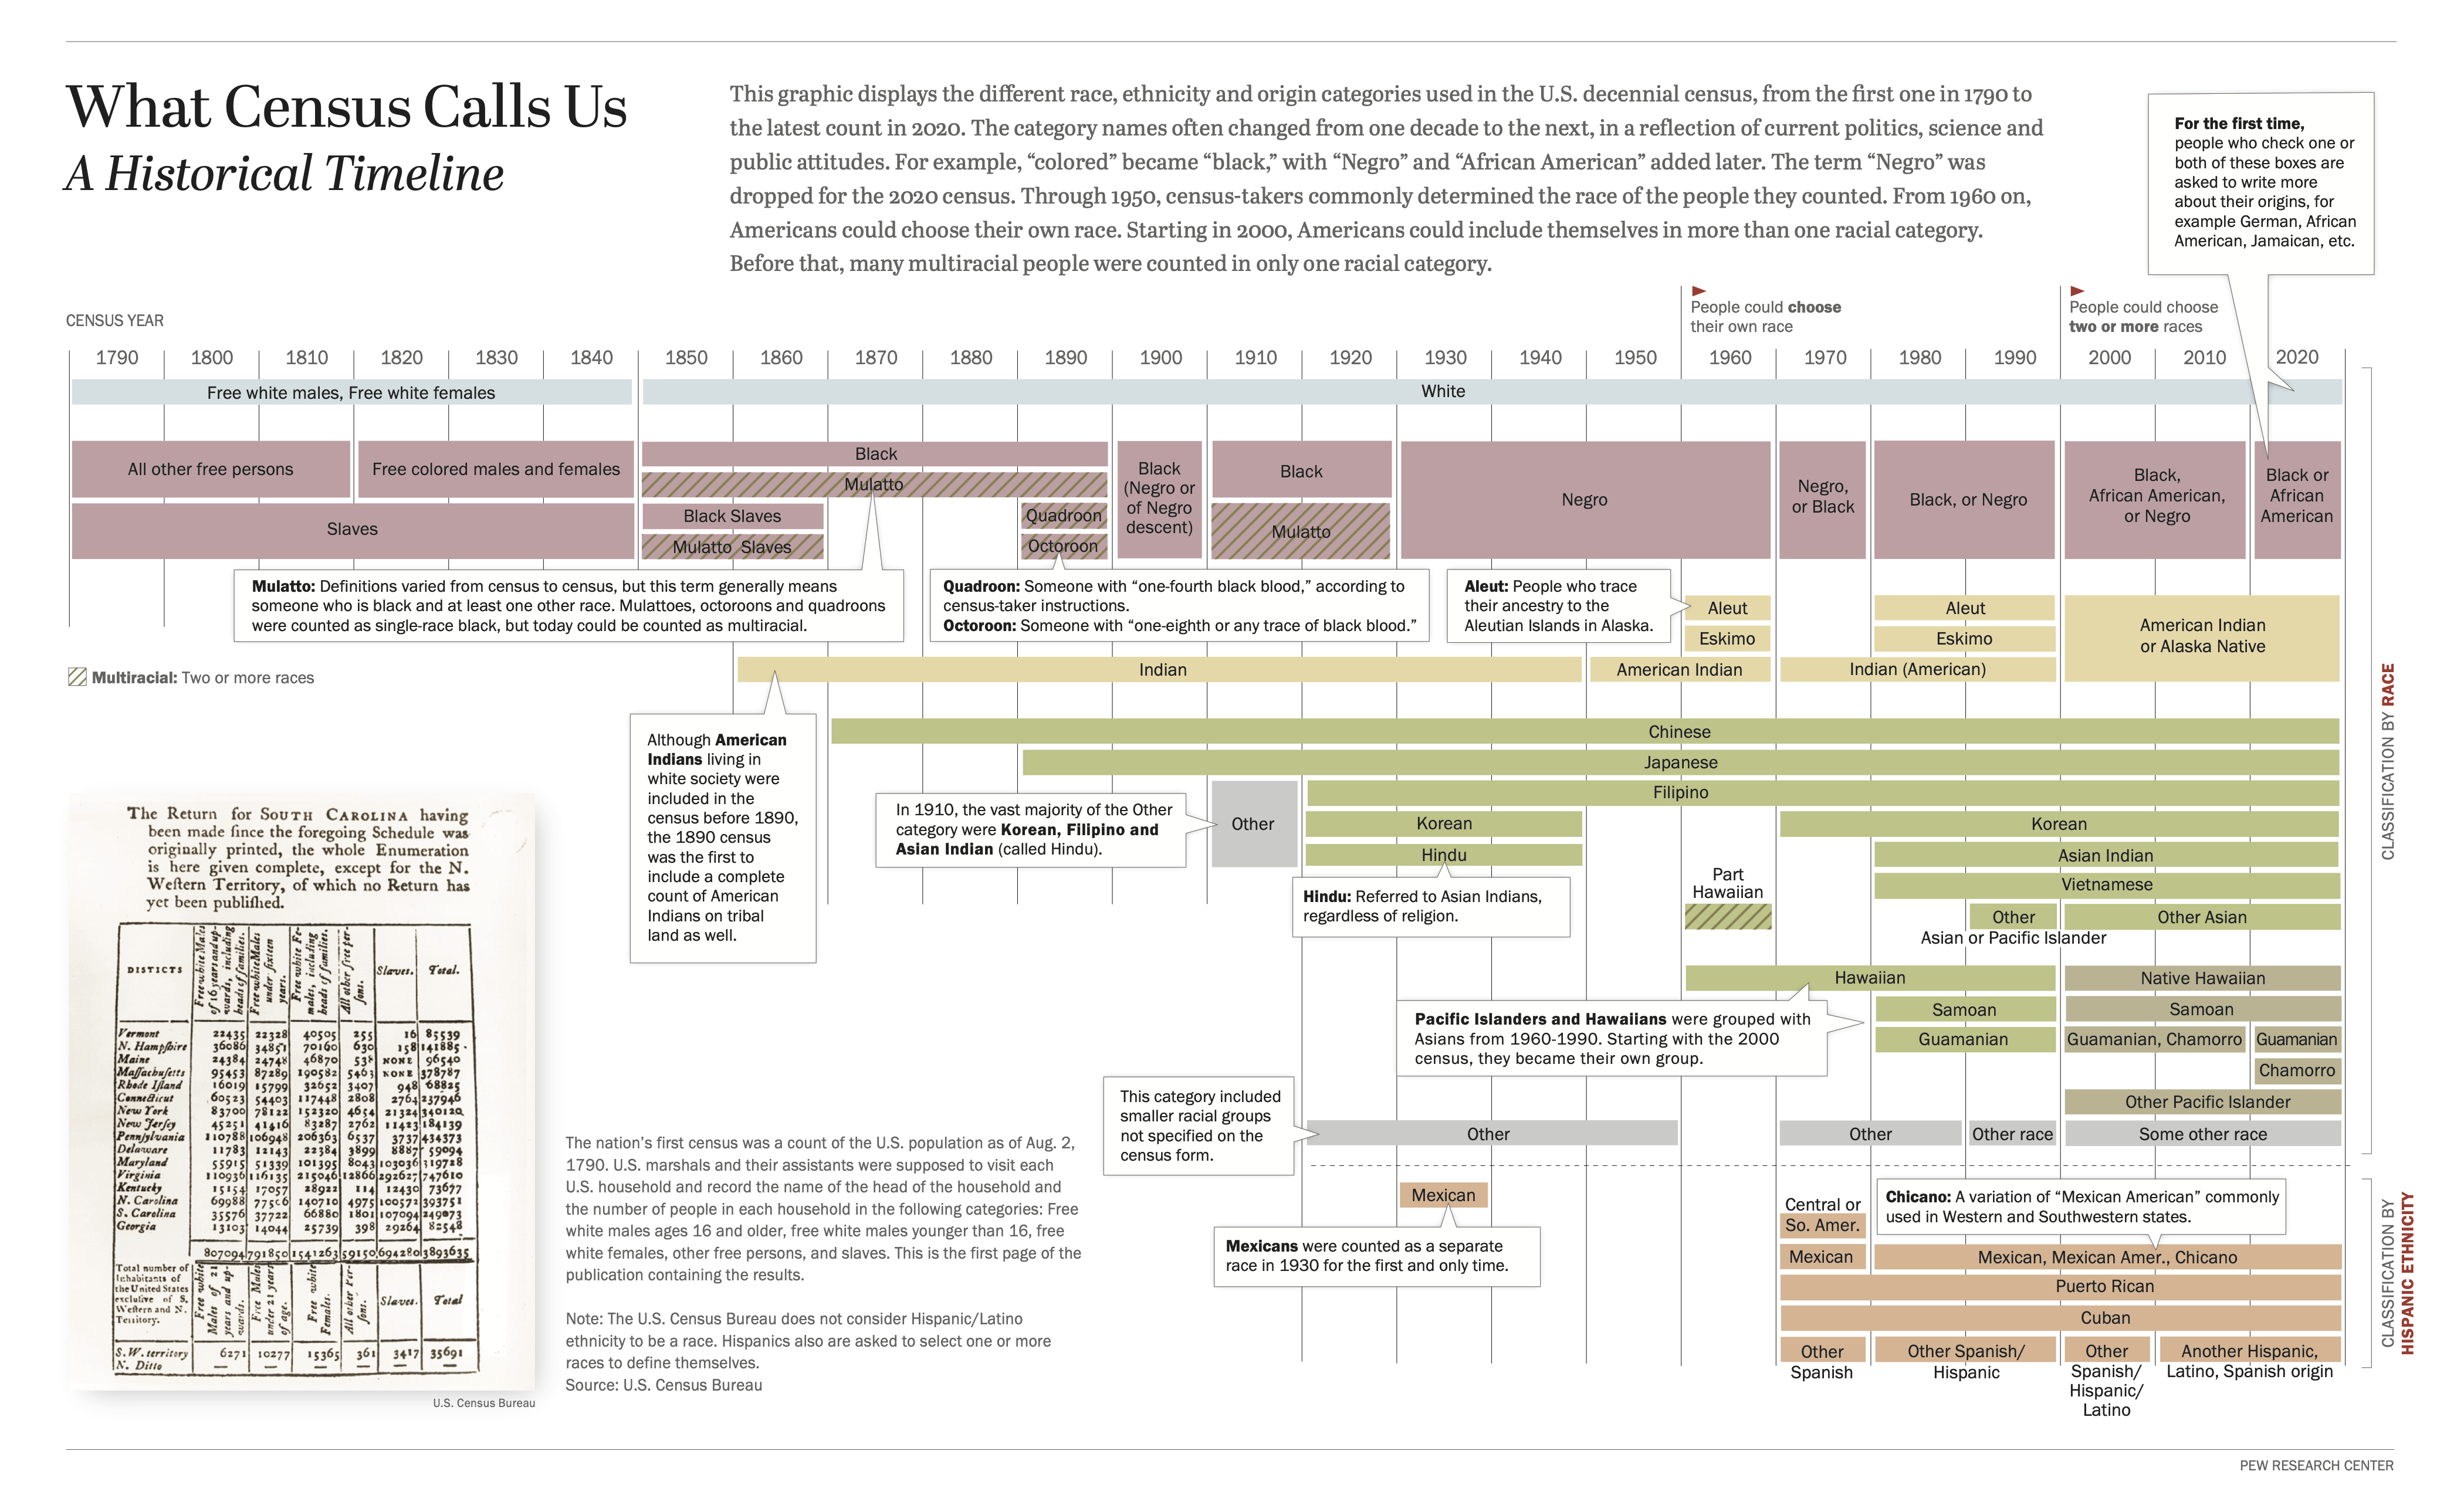
Many people are confused by or dissatisfied with the census race and ethnicity questions, which have been solicited since the first census in 1790. This can be attributed to, at least in part, the questions, categories, and labels changing from one decade to the next, reflecting current politics, scholarship, public attitudes, cultural norms, and community advocacy, demonstrating the malleability of race in the U.S. Figure 2.1.3 displays the different race, ethnicity, and origin categories used in the census from 1790 to 2020 and the subsequent list points to the changing ways Hispanics have been identified over the years. It should be noted that “[t]hrough 1950, census-takers commonly determined the race of the people they counted. From 1960 on, Americans could choose their own race.”14
The text in Figure 2.1.3 reads, “This graphic displays the different race, ethnicity, and origin categories used in the U.S. decennial census, from the first one in 1790 to the latest count in 2020. The category names often changed from one decade to the next, in a reflection of the current politics, science, and public attitudes. For example, “colored” became “black,” with “Negro” and “African American” added later and Starting in 2000, Americans could include themselves in more than one racial category. Before that, many multiracial people were counted in only one racial category.”
The timeline from 1790 to 2020 shows the ten-year cycle of Census dates and includes seven layers corresponding to six racial categories (White, Black or African American, American Indian or Alaskan Native, Asian, Pacific Islander, and some other race), and one ethnic category (Hispanic, Latino, or Spanish origin). The categories in each group are listed here by the year they were first collected, with a note if they replaced a previously used category or were newly added.
White: First included in 1790 as “Free white males, Free white males,” replaced in 1850 with “White” until the present.
Black or African American: First included in 1790 as “All other free persons” and “Slaves,” which was replaced in 1820 with “Free colored males and females” and “Slaves.” In 1850, all categories were replaced with “Black,” “Mulatto,” “Black Slaves,” and “Mulatto Slaves.” In 1870, both categories of enslaved people were removed, and enslaved people were accounted with other free Black and multiracial individuals categorized at the time as “Mulatto.” In 1890, “Quadroon” and “Octoroon” were added. In 1900, the previous categories were replaced with “Black (Negro of Negro descent),” which was replaced in 1910 with “Black” and “Mulatto.” Since 1930, a single category has been used, starting with “Negro,” until it changed to “Negro or Black” in 1970, then “Black or Negro” in 1980 until 2000, when it became “Black African American, or Negro” and then “Black or African American” in 2020.
“Mulatto: Definitions varied from census to census, but this term generally means someone who is black and at least one other race. Mulattoes, octoroons, and quadroons were counted as single-race black, but today could be counted as multiracial.”
“Quadroon: Someone with ‘one-fourth black blood,’ according to census-taker instructions.”
“Octoroon: Someone with ‘one-eighth or any trace of black blood.’”
American Indian or Alaska Native: The first category added on the Census beyond Black and white was “Indian” in 1860. “Although American Indians living in white society were included in the census before 1890, the 1890 census was the first to include a complete count of American Indians on tribal land as well.” In 1860 the Census began by asking about “Indian” identity, which continued until 1950 when it was changed to “American Indian.” In 1960, separate categories were added for Aleut and Eskimo. “Aleut: People who trace their ancestry to the Aleutian Islands in Alaska.” In 1970, all three categories were replaced with “Indian (American)” and in 1980, Aluet and Eskimo were re-added. In 2000, these categories were combined into American Indian or Alaska Native.
Asian: In 1870, the Census started counting Asian ancestry using the “Chinese” category. In 1890, Japanese was added, followed by “Other” in 1910. “In 1910, the vast majority of the Other category were Korean, Filipino and Asian Indian (called Hindu).” These groups were added in 1920. As an imposed term, “Hindu: Referred to Asian Indians, regardless of religion.” In 1950, Korean and Hindu were removed from the options, leaving Chinese, Japanese, and Filipino. In 1960, the survey added Part Hawaiian and Hawaiian. “Pacific Islanders and Hawaiians were grouped with Asians from 1960-1990. Starting with the 2000 census, they became their own group.” In 1970, the Census re-added Korean, and in 1980 added “Asian Indian” (formerly labeled “Hindu”) and also added for the first time Vietnamese, Samoan, and Guamanian. In 1990, “Other Asian or Pacific Islander” was included as an option. For the next census, because Asian and Pacific Islander categories were separated, this category became “Other Asian.”
Pacific Islander: Three groups, Hawaiian, Samoan, and Guamanian were originally included with the “Asian” categories. In 2000, these were recognized as “Pacific Islander,” Guamanian was changed to “Guamanian or Chamorro” and the option “Other Pacific Islander” was included. In 2020, Guamanian and Chamorro were separated.
Other: The “Other” option was first included in 1910 and largely referred to people of Asian heritage. With the inclusion of other groups, this category came to include people of smaller groups and people of multiracial backgrounds who do not want to select just one race (until 2000 when the option to select multiple categories was added). Other was included until 1960 and then re-added in 1970. In 1990 the label was changed to “Other race” and in 2000 updated to “Some other race.”
The events summarized in the section on Hispanic, Latino, and Spanish origin ethnicity are detailed in the following section.
The image also includes a rendering of a historical Census count from South Carolina with each group tabulated by state in hand-printed script. This is accompanied by the following explanatory note: “The nation’s first census was a count of the U.S. population as of Aug. 2, 1790. U.S. marshals and their assistants were supposed to visit each U.S. household and record the name of the head of the household and the number of people in each household in the following categories: Free white males ages 16 and older, free white males younger than 16, free white females, other free persons, and slaves. This is the first page of the publication containing the results.
Note: The U.S. Census Bureau does not consider Hispanic/Latino ethnicity to be a race. Hispanics also are asked to select one or more races to define themselves.” The categorization of Hispanics and Latinos is described in the following detailed timeline:
1930 - Mexicans were counted as a separate race (not an ethnicity or nationality) for the first and only time. Prior to this, they were categorized racially as white, dating back to the first time they were included in the census in 1850.
1940 - The Mexican racial category was removed and “persons of Mexican birth or ancestry who were not defined as Indian or some other nonwhite race” were once again deemed white, and marked as a Spanish-speaking population.15
1950 and 1960 - Mexicans were counted as “white persons of Spanish surname.”
1970 - A question on “Origin or Descent” was added with an option to choose one of the following: Mexican; Puerto Rican; Cuban; Central or South American; Other Spanish. Mexican, Puerto Rican, and Cuban origins were separately identified due to these groups being the largest estimated Hispanic populations in the U.S. at the time.
1980 - “Hispanic” and “not Hispanic” were deemed distinct and separated from race. According to the Census, individuals who are Hispanic may be of any race. The Mexican category was expanded to include “Mexican, Mexican-Amer[ican], Chicano.”
1990 - For the Hispanic origin question, a list of examples and a write-in line were introduced that read, “Print one group, for example, Argentinean, Colombian, Dominican, Nicaraguan, Salvadoran, Spaniard, and so on.”
2000 - People could report more than one race for the first time. “Other Spanish/Hispanic” was changed to “Another Hispanic, Latino, Spanish origin,” which introduced the Latino label.
2010 - “Another Hispanic, Latino, or Spanish origin” category now provided examples of six Hispanic origin groups “(Argentinean, Colombian, Dominican, Nicaraguan, Salvadoran, Spaniard, and so on)” and instructed respondents to “print origin.”
2020 - The example Hispanic groups were revised to represent the largest Hispanic population groups and the geographic diversity of the Hispanic or Latino category.16
Despite the Census questions, categories, and labels changing over time, many Latinxs have clear opinions about their identities. According to studies from the Pew Research Center:
When it comes to describing their identity, most Hispanics prefer their family’s country of origin over pan-ethnic terms. In 2019, 47% of Hispanics reported most often describing themselves by their family’s country of origin, using labels such as “Mexican” or “Cuban” or “Dominican,” for example.17
Most Hispanics do not perceive a shared common culture among U.S. Hispanics. According to a 2011 national survey of Latinos, nearly seven-in-ten (69%) say Hispanics in the U.S. have many different cultures, while 29% say Hispanics in the U.S. share a common culture.18 Like the prior point, this statistic suggests that among Hispanics, national identities remain prevalent.
“Hispanic” or “Latino”? Most don’t care—but among those who do, “Hispanic” is preferred. More than half (54%) say they have no preference for either term. When a preference is expressed, “Hispanic” is preferred over “Latino”—27% versus 18%.19
Most Afro-Latinos identify as “Hispanic” or “Latino,” but not all do. About one in seven Afro-Latinos do not identify as Hispanic. As of 2020, there are about 6 million Afro-Latino adults in the U.S. (12% of the adult Latino population).20
The racial groups Afro-Latinos identify with can be varied and diverse. When asked about their race on a Census Bureau-style question, about three in ten Afro-Latinos selected White as their race, 25% chose Black and 23% selected “some other race.” An additional 16% selected multiple races, while just 1% said they were Asian. Afro-Latinos who did not identify as Latino were more likely than those who did identify this way to mark Black as their race (59% vs. 17%).21
Most Hispanics use Spanish, but the use of English rises through the generations. The same 2011 survey found that 38% of all respondents are Spanish-dominant, 38% are bilingual, and 24% are English-dominant. Among U.S.-born Hispanics, more than half (51%) are English-dominant.
Hispanics also want future U.S. Hispanic generations to speak Spanish. Fully 95% of Hispanics believe it is very important (75%) or somewhat important (20%) for future generations of Hispanics in the U.S. to be able to speak Spanish.
As you learned in this section, race, ethnicity, and different subgroups have been reclassified and redefined in the census. In “Gateway to Whiteness: The Census and Hispanic/Latino Identity,” Gustavo Chacon Mendoza argues that the census is significant because it shapes national, group, and individual identity through its official classification system. He argues, “by narrowly defining ethnicity and restricting its availability as a census answer, the census will force people to identify themselves in groupings that do not match their social perception and standing.”22 However, the number of Hispanics/Latinos that selected “Some Other Race” swelled in the 2020 census––a selection that can be read as a protest to the current racial categorizations. The census, however, interprets this occurrence as confusion or failure to understand the race question, denying respondents agency. Caribbean scholar Jorge Duany notes, “The existence of a large and growing segment of the U.S. population that perceived itself ethnically as Hispanic or Latino, while avoiding the major accepted racial designations, is a politically explosive phenomenon.”23 In sum, there are major limitations with a government entity attempting to categorize a diverse group of people and impose meanings “from above.” While census data can provide a glimpse into understanding Latinx communities, it is important to also examine the perspectives, stories, and contexts that surround the numbers, which is the goal of the following sections.
Footnotes
2 Jens Manuel Krogstad, Jeffrey S. Passel, and Luis Noe-Bustamante, “Key Facts About U.S. Latinos For National Hispanic Heritage Month,” Pew Research Center, Washington D.C.,September 23, 2022. The term Hispanic is used to describe this population because this is the terminology used by the Census. An explanation of the differences between Hispanic and Latina/o/x/e will be explored in the following section.
15 Tomás Almaguer, “Race, Racialization, and the Latino Populations in the United States,” in The New Latino Studies Reader: A Twenty-First-Century Perspective, eds. Ramón A. Gutiérrez and Tomás Almaguer (Oakland: University of California Press, 2016), 213.
22 Gustavo Chacon Mendoza, “Gateway to Whiteness: The Census and Hispanic/Latino Identity,” in The Latin@ Condition, 2nd ed. (New York: New York University Press, 1998), 48-49.
23 Jorge Duany, “Neither Black nor White,” in The New Latino Studies Reader: A Twenty-First-Century Perspective, eds. Ramón A. Gutiérrez and Tomás Almaguer (Oakland: University of California Press, 2016), 158.