
7.3: Voter Turnout
- Page ID
- 153692

\( \newcommand{\vecs}[1]{\overset { \scriptstyle \rightharpoonup} {\mathbf{#1}} } \)
\( \newcommand{\vecd}[1]{\overset{-\!-\!\rightharpoonup}{\vphantom{a}\smash {#1}}} \)
\( \newcommand{\id}{\mathrm{id}}\) \( \newcommand{\Span}{\mathrm{span}}\)
( \newcommand{\kernel}{\mathrm{null}\,}\) \( \newcommand{\range}{\mathrm{range}\,}\)
\( \newcommand{\RealPart}{\mathrm{Re}}\) \( \newcommand{\ImaginaryPart}{\mathrm{Im}}\)
\( \newcommand{\Argument}{\mathrm{Arg}}\) \( \newcommand{\norm}[1]{\| #1 \|}\)
\( \newcommand{\inner}[2]{\langle #1, #2 \rangle}\)
\( \newcommand{\Span}{\mathrm{span}}\)
\( \newcommand{\id}{\mathrm{id}}\)
\( \newcommand{\Span}{\mathrm{span}}\)
\( \newcommand{\kernel}{\mathrm{null}\,}\)
\( \newcommand{\range}{\mathrm{range}\,}\)
\( \newcommand{\RealPart}{\mathrm{Re}}\)
\( \newcommand{\ImaginaryPart}{\mathrm{Im}}\)
\( \newcommand{\Argument}{\mathrm{Arg}}\)
\( \newcommand{\norm}[1]{\| #1 \|}\)
\( \newcommand{\inner}[2]{\langle #1, #2 \rangle}\)
\( \newcommand{\Span}{\mathrm{span}}\) \( \newcommand{\AA}{\unicode[.8,0]{x212B}}\)
\( \newcommand{\vectorA}[1]{\vec{#1}} % arrow\)
\( \newcommand{\vectorAt}[1]{\vec{\text{#1}}} % arrow\)
\( \newcommand{\vectorB}[1]{\overset { \scriptstyle \rightharpoonup} {\mathbf{#1}} } \)
\( \newcommand{\vectorC}[1]{\textbf{#1}} \)
\( \newcommand{\vectorD}[1]{\overrightarrow{#1}} \)
\( \newcommand{\vectorDt}[1]{\overrightarrow{\text{#1}}} \)
\( \newcommand{\vectE}[1]{\overset{-\!-\!\rightharpoonup}{\vphantom{a}\smash{\mathbf {#1}}}} \)
\( \newcommand{\vecs}[1]{\overset { \scriptstyle \rightharpoonup} {\mathbf{#1}} } \)
\( \newcommand{\vecd}[1]{\overset{-\!-\!\rightharpoonup}{\vphantom{a}\smash {#1}}} \)
\(\newcommand{\avec}{\mathbf a}\) \(\newcommand{\bvec}{\mathbf b}\) \(\newcommand{\cvec}{\mathbf c}\) \(\newcommand{\dvec}{\mathbf d}\) \(\newcommand{\dtil}{\widetilde{\mathbf d}}\) \(\newcommand{\evec}{\mathbf e}\) \(\newcommand{\fvec}{\mathbf f}\) \(\newcommand{\nvec}{\mathbf n}\) \(\newcommand{\pvec}{\mathbf p}\) \(\newcommand{\qvec}{\mathbf q}\) \(\newcommand{\svec}{\mathbf s}\) \(\newcommand{\tvec}{\mathbf t}\) \(\newcommand{\uvec}{\mathbf u}\) \(\newcommand{\vvec}{\mathbf v}\) \(\newcommand{\wvec}{\mathbf w}\) \(\newcommand{\xvec}{\mathbf x}\) \(\newcommand{\yvec}{\mathbf y}\) \(\newcommand{\zvec}{\mathbf z}\) \(\newcommand{\rvec}{\mathbf r}\) \(\newcommand{\mvec}{\mathbf m}\) \(\newcommand{\zerovec}{\mathbf 0}\) \(\newcommand{\onevec}{\mathbf 1}\) \(\newcommand{\real}{\mathbb R}\) \(\newcommand{\twovec}[2]{\left[\begin{array}{r}#1 \\ #2 \end{array}\right]}\) \(\newcommand{\ctwovec}[2]{\left[\begin{array}{c}#1 \\ #2 \end{array}\right]}\) \(\newcommand{\threevec}[3]{\left[\begin{array}{r}#1 \\ #2 \\ #3 \end{array}\right]}\) \(\newcommand{\cthreevec}[3]{\left[\begin{array}{c}#1 \\ #2 \\ #3 \end{array}\right]}\) \(\newcommand{\fourvec}[4]{\left[\begin{array}{r}#1 \\ #2 \\ #3 \\ #4 \end{array}\right]}\) \(\newcommand{\cfourvec}[4]{\left[\begin{array}{c}#1 \\ #2 \\ #3 \\ #4 \end{array}\right]}\) \(\newcommand{\fivevec}[5]{\left[\begin{array}{r}#1 \\ #2 \\ #3 \\ #4 \\ #5 \\ \end{array}\right]}\) \(\newcommand{\cfivevec}[5]{\left[\begin{array}{c}#1 \\ #2 \\ #3 \\ #4 \\ #5 \\ \end{array}\right]}\) \(\newcommand{\mattwo}[4]{\left[\begin{array}{rr}#1 \amp #2 \\ #3 \amp #4 \\ \end{array}\right]}\) \(\newcommand{\laspan}[1]{\text{Span}\{#1\}}\) \(\newcommand{\bcal}{\cal B}\) \(\newcommand{\ccal}{\cal C}\) \(\newcommand{\scal}{\cal S}\) \(\newcommand{\wcal}{\cal W}\) \(\newcommand{\ecal}{\cal E}\) \(\newcommand{\coords}[2]{\left\{#1\right\}_{#2}}\) \(\newcommand{\gray}[1]{\color{gray}{#1}}\) \(\newcommand{\lgray}[1]{\color{lightgray}{#1}}\) \(\newcommand{\rank}{\operatorname{rank}}\) \(\newcommand{\row}{\text{Row}}\) \(\newcommand{\col}{\text{Col}}\) \(\renewcommand{\row}{\text{Row}}\) \(\newcommand{\nul}{\text{Nul}}\) \(\newcommand{\var}{\text{Var}}\) \(\newcommand{\corr}{\text{corr}}\) \(\newcommand{\len}[1]{\left|#1\right|}\) \(\newcommand{\bbar}{\overline{\bvec}}\) \(\newcommand{\bhat}{\widehat{\bvec}}\) \(\newcommand{\bperp}{\bvec^\perp}\) \(\newcommand{\xhat}{\widehat{\xvec}}\) \(\newcommand{\vhat}{\widehat{\vvec}}\) \(\newcommand{\uhat}{\widehat{\uvec}}\) \(\newcommand{\what}{\widehat{\wvec}}\) \(\newcommand{\Sighat}{\widehat{\Sigma}}\) \(\newcommand{\lt}{<}\) \(\newcommand{\gt}{>}\) \(\newcommand{\amp}{&}\) \(\definecolor{fillinmathshade}{gray}{0.9}\)By the end of this section, you will be able to:
- Identify factors that motivate registered voters to vote
- Discuss circumstances that prevent citizens from voting
- Analyze reasons for low voter turnout in the United States
Campaign managers worry about who will show up at the polls on Election Day. Will more Republicans come? More Democrats? Will a surge in younger voters occur this year, or will an older population cast ballots? We can actually predict with strong accuracy who is likely to vote each year, based on identified influence factors such as age, education, and income. Campaigns will often target each group of voters in different ways, spending precious campaign dollars on the groups already most likely to show up at the polls rather than trying to persuade citizens who are highly unlikely to vote.
Counting Voters
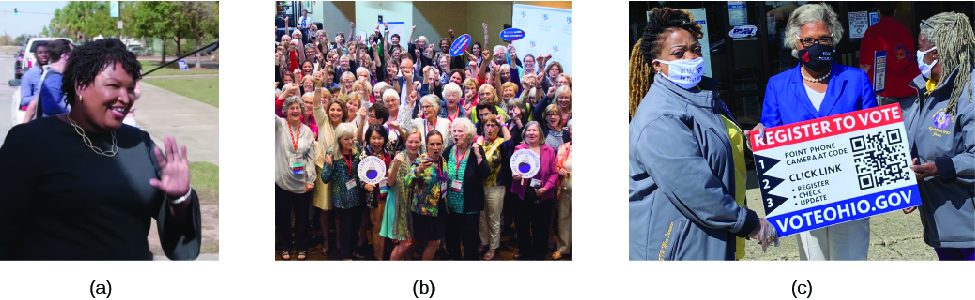
Low voter turnout has long caused the media and others to express concern and frustration. A healthy democratic society is expected to be filled with citizens who vote regularly and participate in the electoral process. Organizations like Rock the Vote and Project Vote Smart (Figure 7.5) work alongside MTV to increase voter turnout in all age groups across the United States. But just how low is voter turnout? The answer depends on who is calculating it and how. There are several methods, each of which highlights a different problem with the electoral system in the United States.
Interested in mobilizing voters? Explore Rock the Vote and The Voter Participation Center for more information.
What Factors Drive Voter Turnout?
Political parties and campaign managers approach every population of voters differently, based on what they know about factors that influence turnout. Everyone targets likely voters, which are the category of registered voters who vote regularly. Most campaigns also target registered voters in general, because they are more likely to vote than unregistered citizens. For this reason, many polling agencies ask respondents whether they are already registered and whether they voted in the last election. Those who are registered and did vote in the last election are likely to have a strong interest in politics and elections and will vote again, provided they are not angry with the political system or politicians.
Some campaigns and civic groups target members of the voting-eligible population who are not registered, especially in states that are highly contested during a particular election. The Association of Community Organizations for Reform Now (ACORN), which is now defunct, was both lauded and criticized for its efforts to get voters in low socio-economic areas registered during the 2008 election.27 Similarly, interest groups in Los Angeles were criticized for registering homeless citizens as a part of an effort to gather signatures to place propositions on the ballot.28 These potential voters may not think they can vote, but they might be persuaded to register and then vote if the process is simplified or the information they receive encourages them to do so.
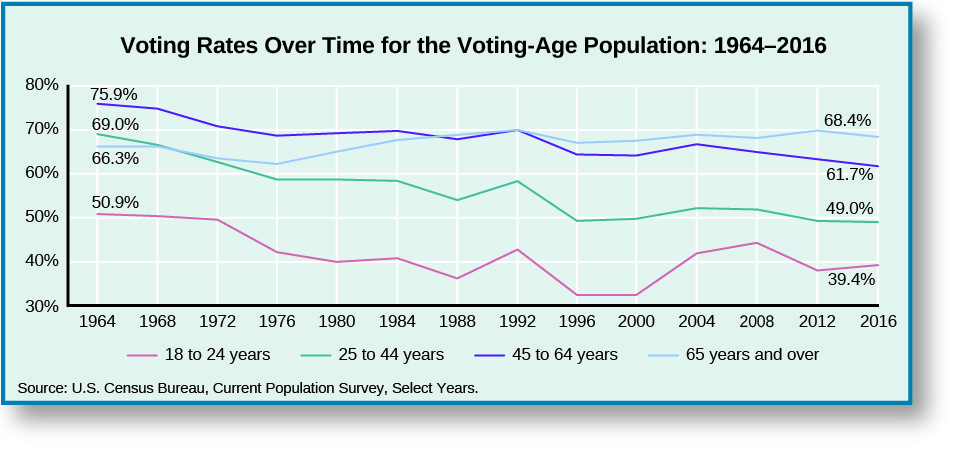
Campaigns also target different age groups with different intensity, because age is a relatively consistent factor in predicting voting behavior. Those between eighteen and twenty-five are least likely to vote, while those sixty-five to seventy-four are most likely. One reason for lower voter turnout among younger citizens may be that they move frequently.29 Another reason may be circular: Youth are less active in government and politics, leading the parties to neglect them. When people are neglected, they are in turn less likely to become engaged in government.30 They may also be unaware of what a government provides. Younger people are often still in college, perhaps working part-time and earning low wages. They are unlikely to be receiving government benefits beyond Pell Grants or government-subsidized tuition and loans. They are also unlikely to be paying taxes at a high rate. Government is a distant concept rather than a daily concern, which may drive down turnout.
In 2016, for example, the Census Bureau reported that only 51 percent of eligible voters between the ages of eighteen and twenty-four registered and 39 percent voted, while 75 percent of sixty-five to seventy-four-year-olds registered and 68 percent voted.31 Once a person has retired, reliance on the government will grow if they draw income from Social Security, receive health care from Medicare, and enjoy benefits such as transportation and social services from state and local governments (Figure 7.7).

Making a Difference
In 2008, for the first time since 1972, a presidential candidate intrigued America’s youth and persuaded them to flock to the polls in record numbers. Barack Obama not only spoke to young people’s concerns but his campaign also connected with them via technology, wielding texts and tweets to bring together a new generation of voters (Figure 7.9).
What qualities should a presidential or congressional candidate show in order to get college students excited and voting? Why?
Citizens’ socioeconomic status—the combination of education, income, and social status—may also predict whether theye will vote. Among those who have completed college, the 2020 voter turnout rate jumps to 80 percent of eligible voters, compared to about 60 percent for those without a college degree.34 This is due in part to the powerful effect of education, one of the strongest predictors of voting turnout. Income also has a strong effect on the likelihood of voting. Citizens earning $150.000 a year or more are very likely to vote and over 80 percent of them do, while only 55 percent of those who earn $25,000 a year vote.35 Once high income and college education are combined, the resulting high socioeconomic status strongly predicts the likelihood that a citizen will vote.
Race is also a factor. White people turn out to vote in the highest numbers, with 71 percent of non-Hispanic White citizens voting in 2020. In comparison, 63 percent of African Americans, 59 percent of Asian Americans, and 54 percent of Hispanic citizens voted in 2020. Voting turnout can increase or decrease based upon the political culture of a state, however. Hispanics, for example, often vote in higher numbers in states where there has historically been higher Hispanic involvement and representation, such as New Mexico, where 59 percent of Hispanic voters turned out in 2020.36 In 2016, while Donald Trump rode a wave of discontent among White voters to the presidency, the fact that Hillary Clinton nearly beat him may have had as much to do with the record turnout of Latinos in response to numerous remarks on immigration that Trump made throughout his campaign. Latinos made up 13 percent of the electorate in 2020, up from nearly 12 percent in 2016, and 10 percent in 2012.37
While less of a factor today, gender has historically been a factor in voter turnout. After 1920, when the Nineteenth Amendment gave women the right to vote, women began slowly turning out to vote, and now they do so in high numbers. Today, more women vote than men. In 2016, a record 73.7 million women (63.3 percent) reporting voting, as compared to 63.8 million men (59.3 percent).38 While women do not vote exclusively for one political party, 41 percent are likely to identify as Democrats and only 25 percent are likely to identify as Republicans.39 The margin that Hillary Clinton won was more narrow in Florida than many presumed it would be and may have helped Donald Trump win that state. Even after allegations of sexual assault and revelations of several instances of sexism by Mr. Trump, Clinton only won 54 percent of the women’s vote in Florida. In contrast, rural voters voted overwhelmingly for Trump, at much higher rates than they had for Mitt Romney in 2012.
Check out this website to find out who is voting and who isn’t.
What Factors Decrease Voter Turnout?
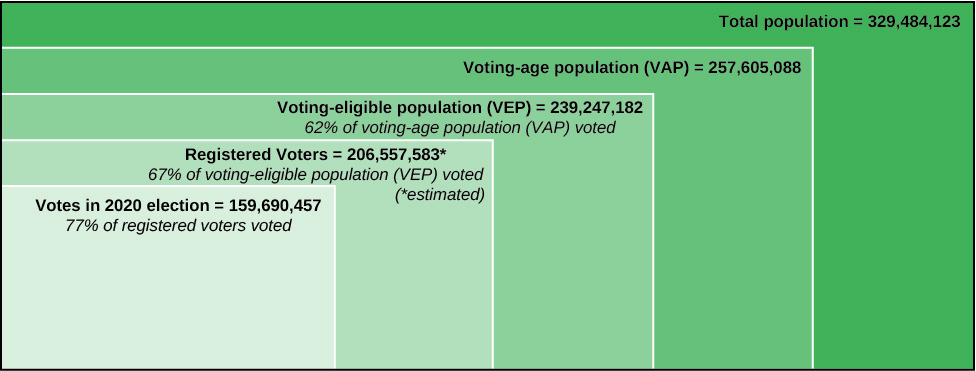
Just as political scientists and campaign managers worry about who does vote, they also look at why people choose to stay home on Election Day. Over the years, studies have explored why a citizen might not vote. The reasons range from the obvious excuse of being too busy (19 percent) to more complex answers, such as transportation problems (3.3 percent) and restrictive registration laws (5.5 percent).40 With only 62 percent of our voting-age population (VAP) voting in the presidential election of 2020, however, we should examine why the rest do not participate.
Do you wonder what voter turnout looks like in other developed countries? Visit the Pew Research Center report on international voting turnout to find out.
Low turnout also occurs when some citizens are not allowed to vote. One method of limiting voter access is the requirement to show identification at polling places. Supporters of strict voter ID requirements argue that these restrictions are required to prevent fraud, such as casting multiple votes, and to maintain the integrity of election results. Opponents, however, claim there is little evidence that such fraud is taking place. Research into the effect of voter ID laws on voter turnout is equally split. Some studies have concluded that strict voter ID laws reduce turnout, especially among minority voters.42 Other studies have determined that such laws have little to no effect on turnout.43
In 2005, the Indiana legislature passed the first strict photo identification law. Voters must provide photo identification that shows their names match the voter registration records, clearly displays an expiration date, is current or has expired only since the last general election, and was issued by the state of Indiana or the U.S. government. Student identification cards that meet the standards and are from an Indiana state school are allowed.44 Indiana’s law allows voters without an acceptable identification to obtain a free state identification card.45 The state also extended service hours for state offices that issue identification in the days leading up to elections.46
The photo identification law was quickly contested. The American Civil Liberties Union and other groups argued that it placed an unfair burden on people who were poor, older, or had limited finances, while the state argued that it would prevent fraud. In Crawford v. Marion County Election Board (2008), the Supreme Court decided that Indiana’s voter identification requirement was constitutional, although the decision left open the possibility that another case might meet the burden of proof required to overturn the law.47
In 2011, Texas passed a strict photo identification law for voters, allowing concealed-handgun permits as identification but not student identification. The Texas law was blocked by the Obama administration before it could be implemented, because Texas was on the Voting Rights Act’s preclearance list. Other states, such as Alabama, Alaska, Arizona, Georgia, and Virginia similarly had laws and districting changes blocked.48 As a result, Shelby County, Alabama, and several other states sued the U.S. attorney general, arguing the Voting Rights Act’s preclearance list was unconstitutional and that the formula that determined whether states had violated the VRA was outdated. In Shelby County v. Holder (2013), the Supreme Court agreed. In a 5–4 decision, the justices in the majority said the formula for placing states on the VRA preclearance list was outdated and reached into the states’ authority to oversee elections.49 States and counties on the preclearance list were released, and Congress was told to design new guidelines for placing states on the list.
Following the Shelby decision, Texas implemented its photo identification law, leading plaintiffs to bring cases against the state, charging that the law disproportionally affects minority voters.50 Alabama, Georgia, and Virginia similarly implemented their photo identification laws, joining Kansas, South Carolina, Tennessee, and Wisconsin. Some of these states offer low-cost or free identification for the purposes of voting or will offer help with the completion of registration applications, but citizens must provide birth certificates or other forms of identification, which can be difficult and/or costly to obtain.
Opponents of photo identification laws argue that these restrictions are unfair because they have an unusually strong effect on some demographics. One study, done by Reuters, found that requiring a photo ID would disproportionally prevent citizens aged 18–24, Hispanics, and those without a college education from voting. These groups are unlikely to have the right paperwork or identification, unlike citizens who have graduated from college. The same study found that 4 percent of households with yearly incomes under $25,000 said they did not have an ID that would be considered valid for voting.51 For this reason, some assert that such changes tend to favor Republicans over Democrats. In the 2018 elections, there were controversial results and allegations of voter suppression in Florida, Georgia, and North Carolina, three jurisdictions where elections were very close.52 Additional allegations of voter suppression emerged in 2020 in many states, including Georgia and Texas. In some places in Georgia, voters had to wait for ten hours to cast their votes.53 In Texas, many drive-by voting stations employed during the primary election to assist with voting during COVID-19 were eliminated for the general election.54 In many states in 2021, policies were considered to further constrict voting, including Georgia's new law.
Another reason for not voting is that polling places may be open only on Election Day. This makes it difficult for voters juggling school, work, and child care during polling hours (Figure 7.10). Many states have tried to address this problem with early voting, which opens polling places as much as two weeks early. Texas opened polling places on weekdays and weekends in 1988 and initially saw an increase in voting in gubernatorial and presidential elections, although the impact tapered off over time.55 Other states with early voting, however, showed a decline in turnout, possibly because there is less social pressure to vote when voting is spread over several days.56 Early voting was used in a widespread manner across forty-four states in 2020, totaling over 100 million votes cast in this manner.57

In a similar effort, Colorado, Hawaii, Oregon, Utah, and Washington have moved to mail-in voting systems.58 These states have seen a rise in turnout, with Colorado’s numbers increasing from 1.8 million votes in the 2010 congressional elections to 2.6 million votes in the 2018 congressional elections.59 , 60 One argument against early and mail-only voting is that those who vote early cannot change their minds during the final days of the campaign, such as in response to an “October surprise,” a highly negative story about a candidate that leaks right before Election Day in November. (For example, a week before the 2000 election, a Dallas Morning News journalist reported that George W. Bush had lied about whether he had been arrested for driving under the influence.61) In 2016, two such stories, one for each nominee, broke just prior to Election Day. First, the Billy Bush Access Hollywood tape showed a braggadocian Donald Trump detailing his ability to do what he pleases with women, including grabbing at their genitals. This tape led some Republican officeholders, such as Senator Jeff Flake (R-AZ), to disavow Trump. However, perhaps eclipsing this episode was the release by former FBI director James Comey of a letter to Congress re-opening the Hillary Clinton email investigation a mere eleven days prior to the election. It is impossible to know the exact dynamics of how someone decides to vote, but one theory is that women jumped from Trump after the Access Hollywood tape emerged, only to go back to supporting him when the FBI seemed to reopen its investigation. Moreover, we later learned of significant Russian meddling in the 2016 election. Robert S. Mueller III, a well-respected former FBI director for presidents from both parties, was appointed as the independent special investigator to delve into matters related to the 2016 election and potential interaction between Russian actors and American election processes.62 That investigation led to a host of Trump campaign and Trump administration officials facing indictments and convictions, including his former campaign manager Paul Manafort, personal attorney Michael Cohen, and long-time confidant Roger Stone. To date, the former president has not faced charges.63 The 2020 elections, which saw record turnout despite the COVID-19 pandemic, were declared by election experts to be the safest and most carefully monitored elections in American history.64
Apathy may also play a role. Some people avoid voting because their vote is unlikely to make a difference or the election is not competitive. If one party has a clear majority in a state or district, for instance, members of the minority party may see no reason to vote. Democrats in Utah and Republicans in California are so outnumbered that they are unlikely to affect the outcome of an election, and they may opt to stay home. Because the presidential candidate with the highest number of popular votes receives all of Utah’s and California’s electoral votes, there is little incentive for some citizens to vote: they will never change the outcome of the state-level election. These citizens, as well as those who vote for third parties like the Green Party or the Libertarian Party, are sometimes referred to as the chronic minority. While third-party candidates sometimes win local or state office or even dramatize an issue for national discussion, such as when Ross Perot discussed the national debt during his campaign as an independent presidential candidate in 1992, they never win national elections.
Finally, some voters may view non-voting as a means of social protest or may see volunteering as a better way to spend their time. Younger voters are more likely to volunteer their time rather than vote, believing that serving others is more important than voting.65 Possibly related to this choice is voter fatigue. In many states, due to our federal structure with elections at many levels of government, voters may vote many times per year on ballots filled with candidates and issues to research. The less time there is between elections, the lower the turnout.66